Now you can have CTR curve analysis charts.
Looking at CTR curves will help you understand how your keywords are performing in search, and help you understand when you need to address issues such as CTR optimisation. Using the chart, we allow you to visualise your CTR over positions 1-100 by device and/or by keyword type.
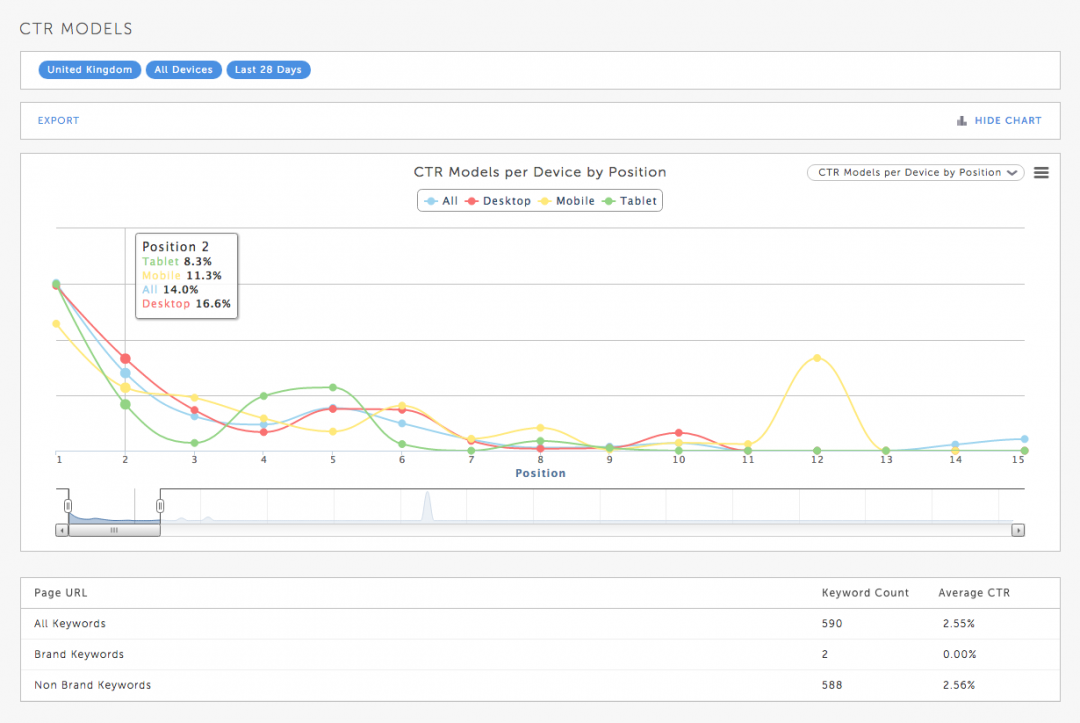
Of course it makes sense at this point to say brand keywords behave differently to non-brand keywords, and that’s why we separate these out in the interface through some clever techniques, so you can automatically split them out and analyse them separately or against each other.