We analyse everything to do with the keywords added by users. From page-level information, down to summary data such as clicks, average position, and CTR — all segmentable at a granular level, such as by device and location. We show all this over time in a handy graph.
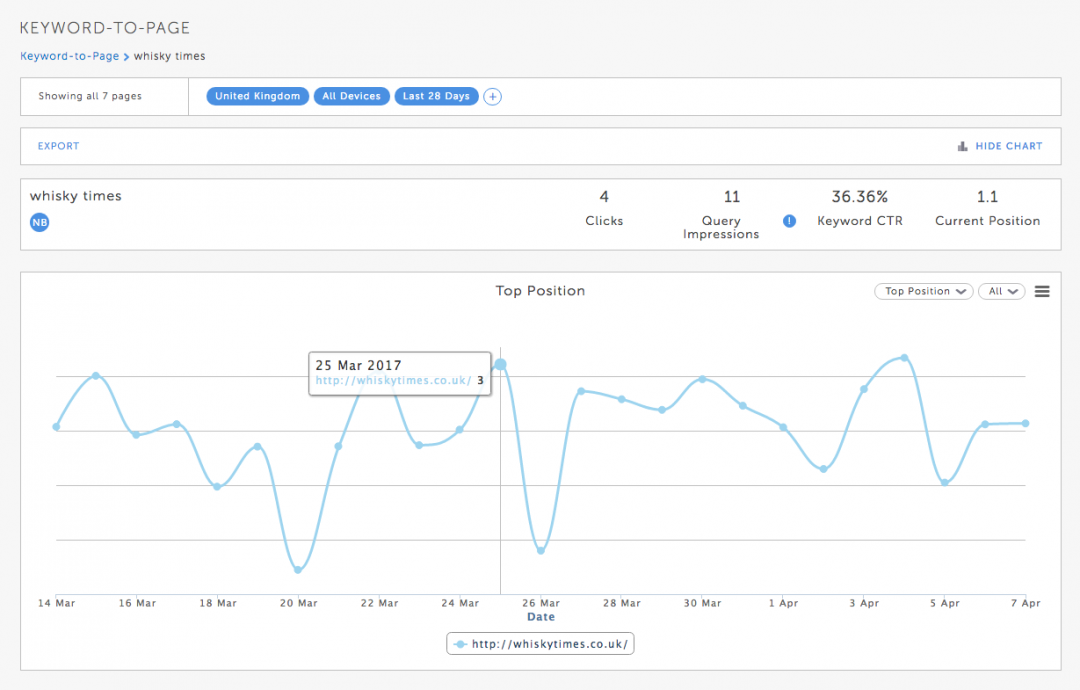
It’s also in this view, where you can see historically which pages were ranking for a keyword, which page ranked the highest, and between which pages a keyword is potentially fluctuating, showing keyword cannibalization issues.
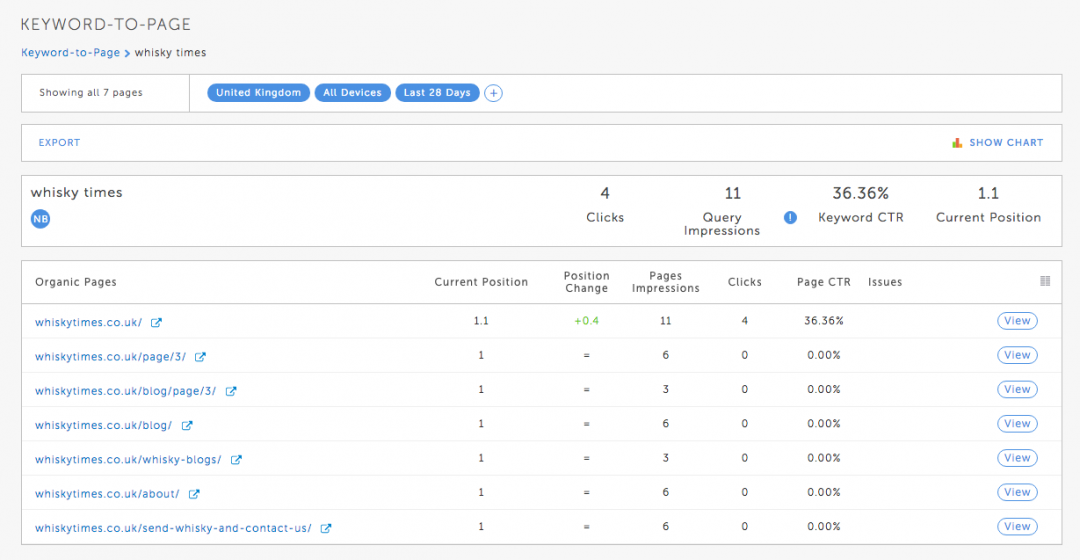
Using this data you can spot issues like the one above where Google is sometimes showing a list page (/page/3/) instead of the homepage (/) and the difference in CTR was 50%+. As a site owner, this information is critical.
You can also view pre-configured graphs which visualize:
- Segments of your ranking data
- Page positions (for cannibalization checks)
- Rankings with top positioned page